Markets
$2,091 = S&P 500 close 4 Dec 2015 (Yahoo Finance)
26.09 = S&P 500 P/E Ratio on 7 Dec 2015 based on previous 10 years of earnings, AKA “Shiller Ratio,” “CAPE Ratio,” or “PE 10.” (www.multpl.com)
$26.1 trillion = total US market capitalization = $18.7 trillion NYSE + $7.4 trillion NASDAQ
$18.3 trillion = annual US GNP estimate (www.BEA.gov, GDP and the National Income and Product Account (NIPA) Historical Tables, Table 1.7.5)
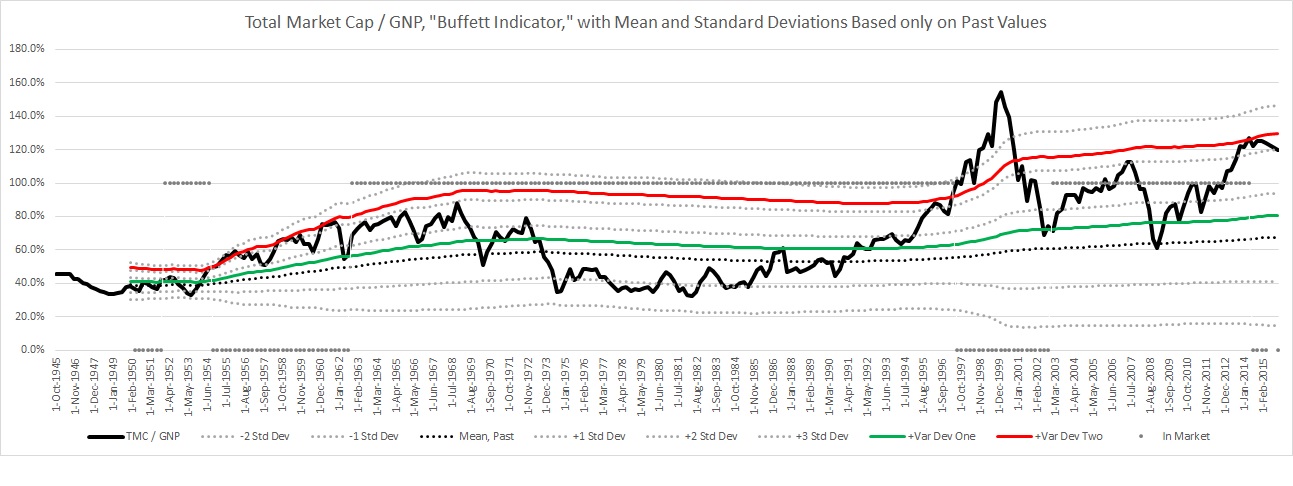
121.5% = “Buffett Indicator” current as of 7 December 2015. This number is a variation* on [Total Market Capitalization] / GNP**.
(The calculation is explained here. Numerator obtained from Federal Reserve Bank of St. Louis, current value obtained by extrapolating with the Wilshire 5000 Index. The denominator is obtained from the BEA’s GNP from above. Calculations and chart in this Excel spreadsheet).
*Instead of using actual market cap value, I used “Nonfinancial corporate business; corporate equities; liability, Level” from the Federal Reserve Bank of St. Louis because the data is available since 1945. That number is only reported quarterly, so the Wilshire 5000 index is used to extrapolate to find the current value.
**The GDP is used by some reports instead of GNP, but Buffett uses the GNP. GDP and GNP are very similar, within about 1% of each other, and don’t fluctuate like total market cap does.
I have to pick an economist. My pick is John P. Hussman. He posts straightforward charts showing strong correlation between current indicators and future results. He uses the S&P 500 to measure performance and he has consistently posted weekly since 2003. All of his posts are available for quick reference: Hussman Funds Weekly Market Comment.
236 = current Consumer Price Index. This number is adjusted so that it averages 100 from 1982-1984. For the first year this number was calculated, 1913, the value was 9.9 (BLS)
0-1/4 = target range for the federal funds rate. (www.federalreserve.gov, 28 Oct 2015 FOMC Statement, and bankrate.com)
“Yield Curve” at stockcharts.com
6.42 = Chinese Yuan Renminbi for 1 US dollar (x-rates.com)
My Market Tools, Long-Term to Specific
- Buffett Indicator from above
- My economist pick: John P. Hussman, referenced above.
- Investor’s Business Daily Big Picture
- CANSLIM checklist for picking individual stocks
Energy
All energy data here is in petajoules = 1 quadrillion joules = “1-with-fifteen-zeros” joules, which can quickly be converted to other units of energy for comparison:
1 petajoule =
- 163,456 barrels of oil, energy from (BOE)
- 277.8 gigawatt-hours = 277,800,000 kilowatt-hours
- 0.02388 million tonnes of oil equivalents (MTOE)
- 0.0009478 quadrillion British Thermal Units (BTU)
- 0.0009202 trillion cubic feet of natural gas, energy from (based on 1,030 BTU / cubic foot, IEA website)
389,000 petajoules = 2013 global energy consumption estimate (International Energy Agency, Key World Statistics 2015)
103,000 petajoules = 2013 US energy consumption estimate, 26.5% of global total (US Energy Information Administration Annual Energy Review, Table 1.1)
See also the US energy flow graph, Section 1.0, for a visualization of energy use.
10,100,000 petajoules = energy contained in the 1,656 billion barrels of proved world petroleum reserves (US Energy Information Administration), using the above conversion as an estimate of the energy equivalent.
7,578,000 petajoules = energy contained in the 6,973 trillion cubic feet of proved world natural gas reserves (US Energy Information Administration). This is probably a very rough estimate because of variance in the energy contained in different natural gas.
$39.93 / barrel = current price of WTI crude oil (US EIA) = $6,527,000 / petajoule of energy
$2.11 / million BTU = Henry Hub spot price of energy from natural gas (US EIA) = $1,942,000 / petajoule from natural gas
6.527 / 1.942 = 3.4: oil energy currently costs 3.4 times as much as natural gas energy.
Commodities
$1,086 = price of one ounce of gold (goldprice.org)
$14.54 = price of one ounce of silver (goldprice.org)
1,086 / 14.54 = 75, current gold-silver ratio, historical range of 14 – 100 since 1975 (goldprice.org charts)
Jobs
322 million = total US population (US Census Bureau Population Clock)
252 million = US civilian noninstitutional population
59.3% = employment-population ratio, which is the percentage of civilian noninstitutional population who are employed. Total employed is 149 million people. This is 46.2% of the total population.
5.0% = “unemployment rate” the most-often-reported percentage that does not include people who are not seeking employment, whether receiving unemployment benefits, welfare, or otherwise.
Click here for historical employment numbers. For more detail in easy-to-read charts, see “Charting the Labor Market.” The data is also broken down regionally and by state.
(US Department of Labor, Bureau of Labor Statistics Current Population Survey, November 2015)
4 thoughts on “Nate’s Numbers Hub December 2015”
Comments are closed.