Tag Archives: News: No News is Good News

No News is Good News

Anything that becomes news sometimes, but only gets reported when it is sensational, scary, or reaches some “crisis” level. This is often statistics-based, and is by nature, boring. However, it is fun to contrast the relative stability that is the status-quo reality of our world with the BREAKING NEWS fever pitch that 24-hour news manages to maintain 24/7.

Big Money 2

I wrote a post called Big Money almost 2 years ago in January 2014. This is a follow-up to that post to update the numbers.

$18.1 trillion = annual US gross domestic product estimate (www.BEA.gov)

$3.2 trillion = US government tax revenue, fiscal year 2015 estimated (http://www.gpo.gov, Fiscal Year 2016, Historical Tables, Table 2.1)

$18.7 trillion = US government national debt as of today (www.treasurydirect.gov)

$0.40 trillion = interest expense on US government outstanding debt, fiscal year 2015 (www.treasurydirect.gov)

0.40 / 18.7 = 2.1% average annual interest rate on the national debt

0.40 / 3.2 = 12%, interest expense as a percentage of tax revenue

$3.53 trillion = currency exchange reserves held by the Chinese government as of Oct 2015 (www.tradingeconomics.com) This has been steadily decreasing since it peaked at $3.99 trillion in mid-2014.

$4.25 trillion = money supply inflation as of Nov 2015 by the practice of quantitative easing (www.federalreserve.gov with data interpretation help by Wikipedia) This amount has been relatively steady since Oct 2014.

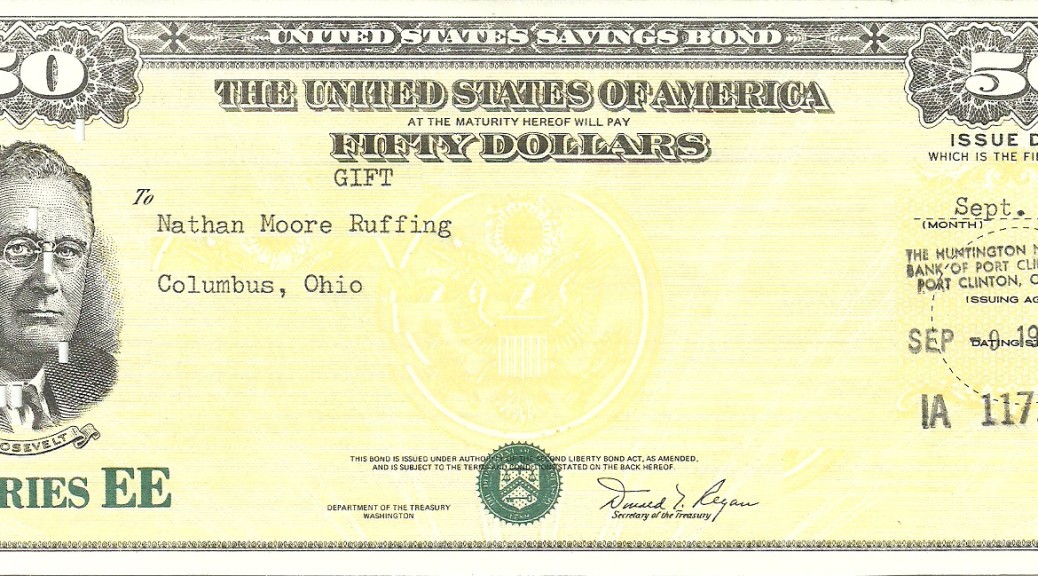
All of the US government numbers come directly from balance sheets available on .gov sites. It was calming to find the numbers I’ve heard about in the news on a regular old balance sheet. I don’t think I will rush to cash in my savings bond.

Big Money

Consider these numbers to put some current news topics in perspective:

$16.9 trillion = annual US gross domestic product estimate (www.BEA.gov)

$2.7 trillion = total US government annual tax revenue, fiscal year 2013 estimated (http://www.gpo.gov, Fiscal Year 2014, Historical Tables, Table 2.1)

$17.2 trillion = US government national debt (www.treasurydirect.gov)

$3.66 trillion = currency exchange reserves held by the Chinese government as of Oct 2013 (www.blogs.wsj.com)

$3.57 trillion = money supply inflation as of Oct 2013 by the practice of quantitative easing (www.federalreserve.gov with data interpretation help by Wikipedia)

17.2 / 2.7 = 6.4. The US government owes more than 6 times what it brings in annually with taxes. (per my own math)

3.66 / 2.7 = 1.4. the value of China’s foreign exchange reserves are equal to the US government tax revenue for a over year and a quarter.

Check out the links. There is a story behind each of these numbers, but the numbers themselves are generally not disputed.